


Authors:
(1) Hyeongjun Kwon, Yonsei University;
(2) Jinhyun Jang, Yonsei University;
(3) Jin Kim, Yonsei University;
(4) Kwonyoung Kim, Yonsei University;
(5) Kwanghoon Sohn, Yonsei University and Korea Institute of Science and Technology (KIST).
Table of Links
4. Method
4.2. Probabilistic hierarchy tree
4.3. Visual hierarchy decomposition
4.4. Learning hierarchy in hyperbolic space
4.5. Visual hierarchy encoding
5. Experiments and 5.1. Image classification
5.2. Object detection and Instance segmentation
6. Ablation studies and discussion
5. Experiments
In this section, we conduct extensive experiments to show the effectiveness of our proposed Hi-Mapper on image classification (Sec. 5.1), object detection and instance segmentation (Sec. 5.2), and semantic segmentation (Sec. 5.3). We apply our Hi-Mapper on both CNNbased [34, 59] and ViT-based [35, 60] backbone networks and compare the performance with the concurrent hierarchyaware baselines [16, 19]. Lastly, we provide ablation studies (Sec. 6) to demonstrate the effectiveness of our contributions.
5.1. Image classification
Settings. We apply our Hi-Mapper on the state-of-theart backbone networks [34, 35, 59, 60] and benchmark on ImageNet-1k [36] dataset. Following [12, 60, 62–64], we use the identical combinations for data augmentation

![Table 1. Performance comparisons for image classification on ImageNet-1K [36] dataset.](https://hackernoon.imgix.net/images/fWZa4tUiBGemnqQfBGgCPf9594N2-80831zp.png?auto=format&fit=max&w=1080)
and regularization strategies [35] after excluding repeated augmentation [65]. We train our model with batch size 1024 for 50 epochs using AdamW [66] with weight decay 1e-4. The initial learning rate is set to 1e-4 and a cosine learning rate scheduler is applied following [35].
Results. Tab. 1 presents classification performance. We report the original performance without the fine-tuning schemes for the plain backbone networks since we observed degradation in performance after fine-tuning the models. Our proposed method consistently achieves better performances than the baseline models with only a slight increase in parameters. Specifically, Hi-Mapper surpasses ResNet50 [34] and EfficientNet-B4 [59] by margins of 2.0% and 1.2%, respectively. Additionally, it achieves improvement on DeiT’s performance by 2.6%/2.8%/1.6%, and Swin [60] by 2.2%/1.1% across various model sizes. The experiments on image classification demonstrate not only the importance of understanding the structured organization of visual scenes, but also the scalability of our method.
5.2. Object detection and Instance segmentation
Settings. We experiment on the COCO [37] dataset. We use the Hi-Mapper backbones derived from Sec. 5.1. Then,

![Table 2. Performance comparisons for object detection and instance segmentation on COCO [37] dataset.(*: Results are reproduced based on [10].](https://hackernoon.imgix.net/images/fWZa4tUiBGemnqQfBGgCPf9594N2-4m831kg.png?auto=format&fit=max&w=1920)

![Table 3. Performance comparisons for semantic segmentation on ADE20k [38] dataset. We conduct the single-scale evaluation. FLOPs are measured with 512 \times 2048 input resolution.](https://hackernoon.imgix.net/images/fWZa4tUiBGemnqQfBGgCPf9594N2-l7931a4.png?auto=format&fit=max&w=1080)
we deploy our pre-trained backbone into Mask R-CNN [67]. All models are trained on COCO 2017, including 118k train images and 5k validation images. We follow the standard learning protocols [67], 1\times schedule with 12 epochs. Note that we reproduce DeiT-T with Mask R-CNN based on [68].
Results. In Table 2, we present a comparison of our results with baseline models, such as DeiT and Swin, on the COCO dataset, which demands a higher capacity for fine representation recognition. Our Hi-Mapper consistently boosts all baseline models capability with only a small increase in parameters. Notably, Hi-Mapper significantly improves DeiT-T and -S by margins of 6.8 and 8.3 on the object detection task. Meanwhile, in the instance segmentation, it also improves DeiT-T and -S by margins of 8.6 and 7.2, respectively. This result shows that the visual hierarchy facilitates complex visual scene recognition.
5.3. Semantic segmentation
Settings. We further experiment on the ADE20K [38] dataset for semantic segmentation. ADE20K contains

![Table 4. Performance comparison for classification on ImageNet1K [36] according to embedding spaces and combinations of learning objectives.](https://hackernoon.imgix.net/images/fWZa4tUiBGemnqQfBGgCPf9594N2-v1831rq.png?auto=format&fit=max&w=1080)
Results. We present the performance comparisons on ADE20K in Tab. 3. The results show that our HiMapper achieves comparable or better performance than the baseline models, including DeiT-T, -S, and Swin-T, requiring a smaller increase in the number of parameters and GFLOPs. Specifically, Hi-Mapper on DeiT-T, -S, and Swin-T achieves a performance improvement of 2.0%, 3.3%, and 2.3%. Additionally, as model sizes increase, Hi-Mapper fully capitalizes fine-grained representations for semantic segmentation with a slight increase in computation.
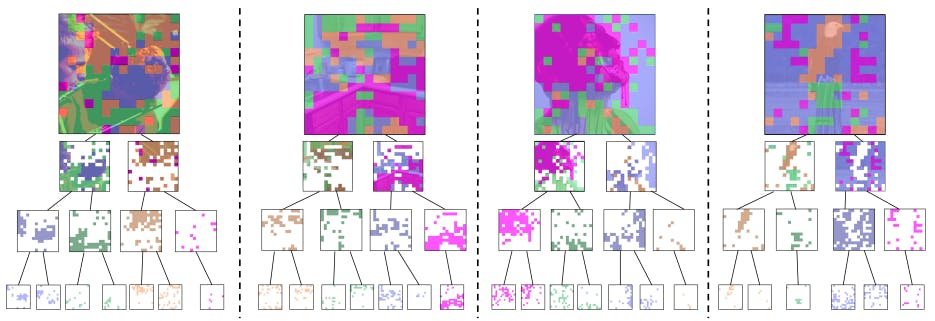
5.4. Visualization
As shown in Fig. 4, we demonstrate our visual hierarchy on images from ImageNet-1K [36]. This confirms that our approach can successfully uncover the inherent hierarchy among visual components without the need for hierarchy or part-level annotations.


![Table 5. Performance comparison for classification on ImageNet1K [36] with respect to the relation modeling in hierarchy tree.](https://hackernoon.imgix.net/images/fWZa4tUiBGemnqQfBGgCPf9594N2-jk931m5.png?auto=format&fit=max&w=1080)
This paper is available on arxiv under CC BY 4.0 DEED license.


