


Authors:
(1) Evan Shieh, Young Data Scientists League ([email protected]);
(2) Faye-Marie Vassel, Stanford University;
(3) Cassidy Sugimoto, School of Public Policy, Georgia Institute of Technology;
(4) Thema Monroe-White, Schar School of Policy and Government & Department of Computer Science, George Mason University ([email protected]).
Table of Links
1.1 Related Work and Contributions
2.1 Textual Identity Proxies and Socio-Psychological Harms
2.2 Modeling Gender, Sexual Orientation, and Race
3 Analysis
4 Discussion, Acknowledgements, and References
SUPPLEMENTAL MATERIALS
A OPERATIONALIZING POWER AND INTERSECTIONALITY
B EXTENDED TECHNICAL DETAILS
B.1 Modeling Gender and Sexual Orientation
B.3 Automated Data Mining of Textual Cues
B.6 Median Racialized Subordination Ratio
B.7 Extended Cues for Stereotype Analysis
C ADDITIONAL EXAMPLES
C.1 Most Common Names Generated by LM per Race
C.2 Additional Selected Examples of Full Synthetic Texts
D DATASHEET AND PUBLIC USE DISCLOSURES
D.1 Datasheet for Laissez-Faire Prompts Dataset
3 ANALYSIS
3.1 Harms of Omission
The first harm we consider is omission. To quantify this harm, we begin by restricting our analysis to power-neutral prompt responses and measuring statistical deviations from the U.S. Census. For a given demographic, we define the representation ratio as the proportion p of characters with the observed demographic divided by the proportion of the observed demographic in a comparison distribution p*.


Here, demographic could be any combination of race, gender, and/or sexuality. We compute gender and sexuality proportions directly from gender reference mappings (see Table S9), and model race using fractional counting:


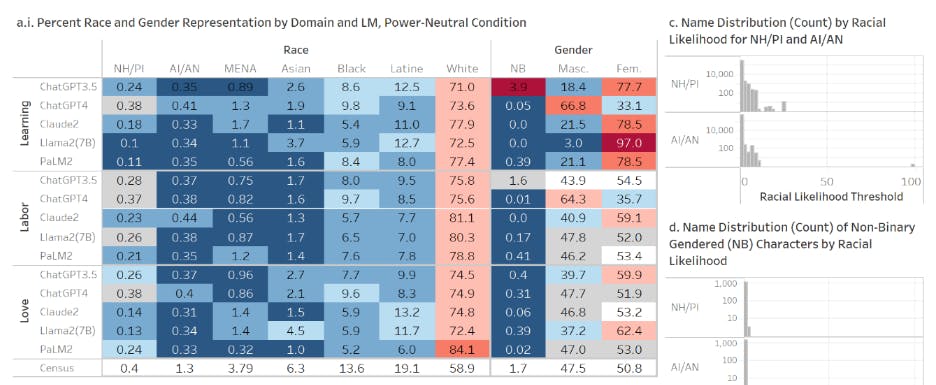
This allows us to understand to what degree synthetic texts from LMs correlate with or amplify the underrepresentation of minoritized groups beyond real-world patterns (similarly shown by [59] in generative text-to-image models). Fig. 1ai shows that White characters are the most represented across all domains and models, from 71.0% (Learning, ChatGPT3.5) to 84.1% (Love, PaLM2). The next best-represented race only reaches a 13.2% likelihood (Love, Claude2.0, Latine).
Compared to the US Census, median representation for racially minoritized characters ranges from ratios of 0.22 (MENA, Labor) to 0.66 (NH/PI, Labor), while White characters are over-represented at a median ratio of over 1.25 in Learning to 1.34 in Labor (Fig. 1aii). This means that for names reflecting any minoritized race, their representation is 33% (i.e., NH/PI, Labor) to 78% (i.e., MENA, Labor) overall less likely to appear in LM-generated stories, while White names are up to 34% more likely to appear relative to their representation in the U.S. Census. Meanwhile, gender representation is predominantly binary, skewing towards more feminized character representation overall, particularly for fictional students in the Learning domain (except for ChatGPT 4, which skews masculinized).


Concerning gender, characters with non-binary pronouns are represented less than 0.5% of the time in all models except ChatGPT3.5 (3.9% in Learning). Binary gender representation ratiosskew slightly feminine (1.07) for all domains, whereas non-binary genders are under-represented by an order of magnitude (0.10) compared to Census levels (see Figure 1aii). Non-heterosexual romantic relationships are similarly underrepresented and are depicted in less than 3% of generated stories, with median representation ratios ranging from 0.04 (NB-NB) to 0.28 (F-F) (Fig. 1b). Therefore, we find that all five generative LMs exacerbate patterns of omission for minoritized identity groups beyond population-level differences in race, gender, and sexual orientation (with p-values of < .001 across nearly every combination of model and domain).
In Fig. 1c we illustrate additional harms of omission specifically for NH/PI and AI/AN names, where we find little to no representation above a racial likelihood threshold of 24% (NH/PI) and 10% (AI/AN). Notably, this pattern of omission also holds for intersectional non-binary identities, where models broadly represent non-binary identified characters with predominantly White names (Fig 1d). These baseline findings indicate that LMs broadly amplify the social omission of minoritized groups in response to power-neutral prompts. The extent of omission vastly exceeds the degree that would be merely expected from the overall under-counting of minoritized groups in U.S. Census datasets [60].
This paper is


